Methodology
Racial Inequality in Delivering the SDGs in the US
Background: This document describes the methodology for calculating racial inequality in delivering the SDGs. The project is an effort to better understand how well the US delivers the SDGs to different racial communities. To do so, it measures SDG achievement from the place of the racial or ethnic community left furthest behind. This is aligned with the Leave No One Behind Agenda, which asserts that those who have been most left out of development must be addressed first through the SDGs. Given the vast geographic and demographic diversity of the United States, the racial group least served varies. As a result, the index is calculated using the score of the group least served in each state and for each indicator.
This methodology was first printed as part of the US Sustainable Development Report, 2018. It has been reproduced here and updated where relevant. The methodology below builds on the methodology established by SDSN and Bertelsmann Stiftung for the SDG Index and Dashboards Report1. The European Commission Joint Research Centre (JRC) conducted in 2019, for the first time, an independent statistical audit of the underlying methodology of this report, first developed by SDSN and Bertelsmann Stiftung for the SDG Index and Dashboards, now called the Sustainable Development Report. The audit evaluated the statistical and conceptual coherence of the index structure. Based on this audit, a few updates have been made. No imputed data is used for this index. Additional information, including raw data, is available online at https://github.com/sdsna/2021USRacialInequality.
First, the 103 state-level indicators used in the US Sustainable Development Report (2018) were reviewed, then the 55 state-level indicators used in the America’s Goals Report Card (2020) were evaluated for racially disaggregated data.
Second, a review was conducted of the indicators that could not be disaggregated, and efforts were made to find a suitable replacement. Finally, a third review was made with expert input to see if there were areas that were both particularly relevant to racial disaggregation, and within the purview of the SDGs, that should be included. All of the selected indicators met the selection criteria developed for the Sustainable Development Report which requires openly available, rigorous, reliable, and consistently updated indicators (below).
To determine quality, technically-sound indicators for selection, we used the following criteria:
- SDG and US state relevance: Data is matched to the SDG targets, then matched to suggested indicators as closely as possible. Finally, when possible, indicators should be relevant to a policy context and/or support communities and leaders in policy-making decisions. Alignment of each indicator to the SDG target or indicator is noted below.
- Statistical quality: Data must be from a reputable source that produces data in a replicable and reliable way. Preference is given to datasets that are updated routinely, so progress can be tracked to 2030, and to datasets that have disaggregated data available, to track progress for all groups.
- Timelines: Data must be published recently, with preference given to data covering the year 2017 or later.
- Coverage: Datasets must provide data for at least 80% of states. Goals 14 and 17 are not included in this index due to issues of data availability and to lack of state-level comparability.
- Comparability: Data was chosen that has a reasonable or scientifically determined threshold. There are several indicators that the UN has recommended for monitoring purposes, that are not well-suited for comparison in an index because there is no consensus on a “best” level of achievement.
- Repeated indicators: Data should not repeat across Goals. Within the SDGs official indicators, there are indicators that are repeated across multiple Goals. This promotes the idea that the SDGs are interconnected and interdisciplinary. However, in order to prevent double counting of indicators within the index calculations, indicators were not repeated across Goals. In cases where an indicator could reasonably fit within multiple SDGs, it was placed within the Goal with the target that was determined to most closely/directly match the language/intent of the indicator.
- Outcome indicators: Whenever possible, data should measure outcomes. In cases where outcome data was unavailable, process or output indicators were used to track policies or actions that have a research-supported impact on outcomes. For example, paid sick leave and paid family leave legislation were used as an indicator for implementing appropriate social protection systems.
For the purposes of this index, the team considered three categories of indicators:
- Context Indicators. Context indicators describe the general conditions in a state. They are also used when a topic is particularly relevant to the SDGs, but racially disaggregated data is not available, or when an indicator has information about race relations generally, like the racism index, but is not specific to a particular racial community.
- Level indicators. Level indicators are those that measure distance to achieving the SDG for a specific racial community.
- Relative Indicators. Relative indicators measure variation in outcomes between white communities and other racial communities.
Every effort was made to find racially disaggregated data for every Goal; however, this was not always possible: Goals 6, 7, and 15 do not contain racially disaggregated data. After all indicators were selected, an analysis was done to determine if any of the indicators within a Goal, and across the index, were collinear. Indicators that were collinear, defined as r2 greater than .6, were removed. Further, efforts were made to equalize the number of indicators per Goal. If a Goal had relatively too many indicators, indicators were removed that were least relevant to the SDGs, to racial contexts, and or to the US context (full list of indicators can be downloaded at https://github.com/sdsna/2021USRacialInequality).
Much of the racial data in this report is derived from federal sources like the Census Bureau (ACS), Center for Disease Control and Prevention (CDC), Bureau of Labor Statistics (BLS) and others. The Census Bureau and associated data consider five main racial groupings: 1) Black or African American, 2) American Indians and Alaska Native, 3) Asian, 4) Native Hawaiian and Other Pacific Islanders, and 5) white. In addition to these, 3 other groupings – ‘Hispanic’, ‘Multiracial’, and ‘Other’ – were used. The Census considers “Hispanic or Latino” to be an ethnicity, which can be used in combination with any racial group. In this project, “Hispanic” is used to refer to all people who selected “Hispanic or Latino”, regardless of racial identification, and to avoid double counting all racial groups are presented exclusive of those with Hispanic or Latino origin. “Indigenous” is used to refer to communities grouped under “American Indians and Alaska Natives,” in accordance with UN terminology. People who selected other Census racial categories may also identify as Indigenous, this term, however, is only applied to only one group to maintain clarity in communications. Beginning in 2000, Multiracial was presented as an option to Census respondents. In 2010, the US Office of Management and Budget (OMB) which offers guidelines around racial data collection to the US Census, offered an umbrella category of “Some Other Race,” this can, but does not necessarily, include the option to detail that race2.
The disaggregated data in this report often, although not always, used the categories listed above. For some included indicators, there is uneven racial data available, for others, all non-white communities are grouped together by the underlying source into a category labeled People of Color (POC). In other cases, some groups were merged by the data provider. Racial groups assigned by underlying sources were not adjusted during collection or analysis. When available data deviates from the Census groupings, it is indicated in the indicator details, and full accounting of included racial and ethnic groups for each indicator is available in the codebook.
Data was included if there was data available for both the white racial community and two other racial communities. If a state only had data for the white racial group, then that indicator was considered ‘missing’ for that state. If a state lacked racial data for more than 25% of racial indicators, no overall score was given to that state.
Survey sample sizes can have important implications for the validity of the data. In many cases, underlying sources suppressed indicator values when sample sizes were too small. In cases where survey metrics were available, coefficient of variation (CV) was used to determine if sample sizes were large enough for reliable population estimates: data that had a CV greater than 30 was suppressed. When underlying sources did not suppress estimates, and survey metrics were not available, estimates for racial communities smaller than 2000 people per state were suppressed. While this supports statistical stability, it also erases the experiences of small racial communities, and may undercount inequality particularly for those communities with a small population as a result of historical racial violence. This is an important area for future research and survey design. Finally, it is important to exercise caution when comparing any two states or racial groups in a state, as not all differences are statically significant.
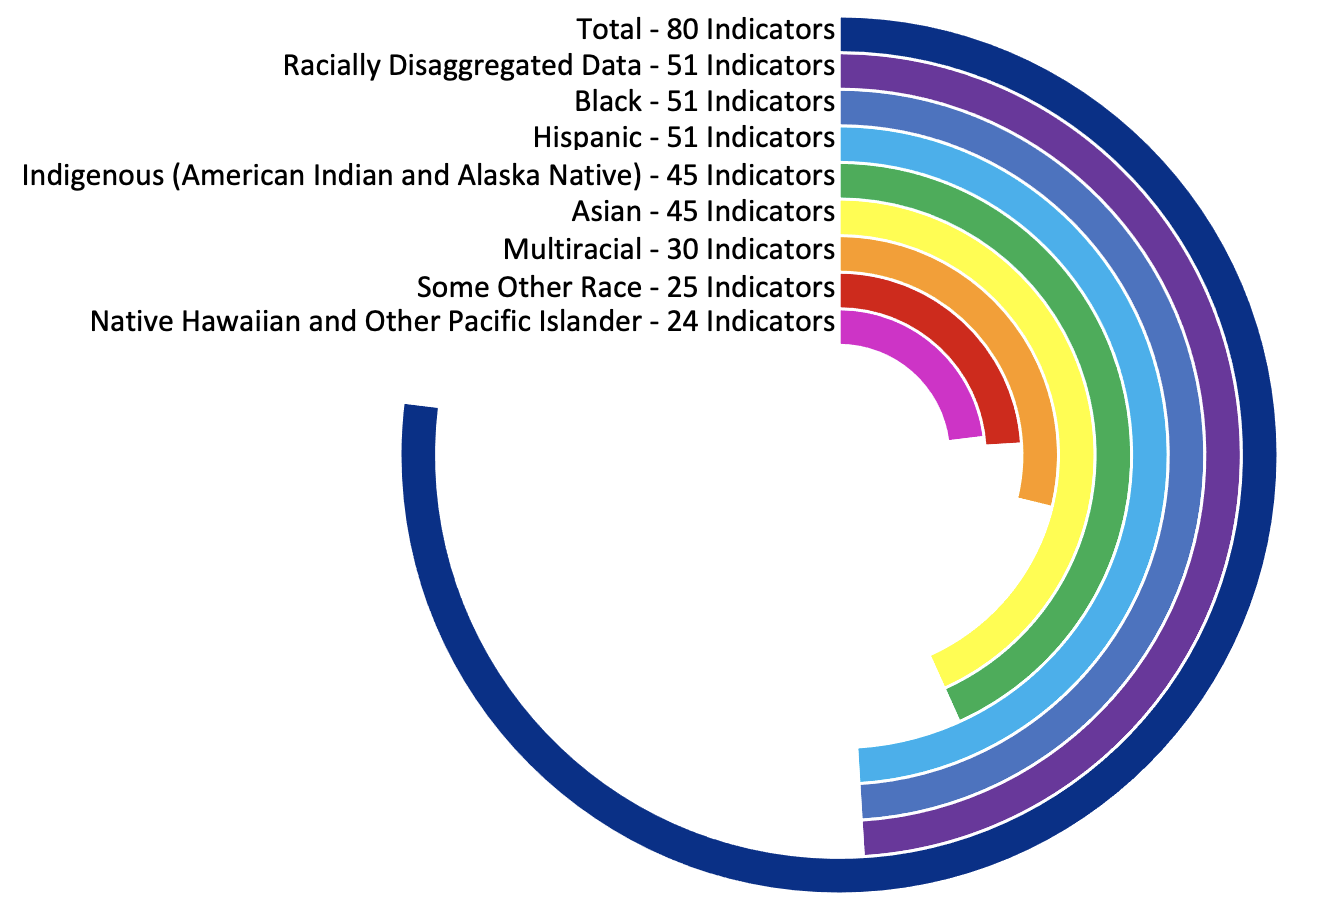
in sum, 80 indicators were used across 15 Goals, 51 included detailed racially disaggregated information -- an additional 5 had racial data that either describes all people of color (State Supreme Court Justices), or context more generally (Racism Index). Of the 51 indicators that were racially disaggregated, 51 had data for Black and Hispanic communities, 45 had data for Indigenous communities (American Indians and Alaska Native), 45 had data for Asian communities, 30 had data for Multiracial communities, 24 had data for Native Hawaiian and Other Pacific Islander communities, and 25 had data for “Other” communities. Beyond indicators that had incomplete racial data, there were many indicators where no racially disaggregated data was found. Goals 6, 7, and 15 have no racially disaggregated data. The table below highlights some, but not all, notable gaps.
Table 1 | Topics Missing Racial Data
| Goal | Topic | Goal | Topic |
|---|---|---|---|
| 1 | Working Poor | 6 | Lead in water |
| 2 | Food Insecurity | 7 | Energy burden |
| 3 | Subjective Wellbeing | 10 | LGBTQ Discrimination |
| 4 | Student Debt | 11 | Accessibility of city services |
| 5 | Contraceptive deserts | 12 | Chemical pollution exposure |
| 5 | Maternal Mortality | 13 | Weather Injuries |
| 5 | Sexual Violence | 15 | Biodiversity protection |
| 5 | LGBT equality and protections |
Whenever possible, relative indicators were constructed as the ratio of outcomes between the white community and a community of another race. These indicators were constructed so that a ratio of one would indicate equality, a ratio greater than one would indicate better outcomes for the white community, and a ratio less than one would indicate better outcomes in the comparison community (see equations 1 and 2).
- Eq 1. Indicator = [white group outcome] / [comparison group outcome], when data is ordered such that a higher score is preferred over a lower score.
Example: Life expectancy, 2030 Goal: 83 years of age - Eq 2. Indicator = [comparison group outcome] / [white group outcome], when data is ordered such that a lower score is preferred over a higher score.
Example: Percent of children living in poverty, 2030 Goal: 0% of children in poverty
Relative disparity was chosen as a method of construction for accessibility of interpretation, i.e., two times more of group A are in poverty than group B, and because it requires less background information or context than absolute measures of difference. For example, if group B has 10 percentage points fewer than Group A, successful interpretation requires understanding if 10 percentage points is a meaningful difference.
However, constructing indicators as a relative disparity was not always possible. For 4 indicators, other constructions were used; for example, where the denominator would be zero (number of justices of color in state supreme courts), or where small differences are meaningful (life expectancy).
After the Level and Relative indicators were constructed for every indicator with racial data, a new ‘least served’ version of each indicator was created that held the value for each indicator and state with the group that had been left the furthest behind (eq. 3 and 4). The ‘least served’ version of each indicator was used alongside the context indicators to calculate Goal and Overall scores.
- Eq 3. Least served indicator (1) = Minimum of [Black indicator (1) value, Hispanic indicator (1) value, Asian indicator (1) value…], for level indicators when data is ordered such that a higher score is preferred over a lower score (i.e., Life expectancy)
- Eq 4. Least served indicator (2) = Maximum of [Black indicator (2) value, Hispanic indicator (2) value, Asian indicator (2) value…], for level indicators when data is ordered such that a lower score is preferred over a higher score (i.e., Children in poverty)
To compare indicators across topics, indicators were rescaled and normalized to a 0-100 scale, with 100 representing SDG achievement for a particular indicator3. The choice of upper (value set to 100) and lower bounds (value set to zero) with which to rescale the data is a sensitive one and can introduce unintended effects into datasets if extreme values and outliers are not taken into account. (Note: in this section the term “upper bound” is used to refer to the target value, even if the indicator data is descending and the most progress is represented by a smaller number, i.e., Child poverty.) Lower bounds are particularly sensitive to outliers as they can impact the rankings of the data. To account for these considerations, this index used the following methodology for determining upper and lower bounds:
- Where upper and lower bounds have been developed for an indicator through another SDSN product, use those bounds.
- For relative indicators, a standard threshold was applied: 1 or equality was set as the upper bound, 1.25 marked the green/yellow boundary, 1.5 marked the yellow/orange boundary, 1.75 marked the orange/red boundary, and 2 was delineated as the ‘worst’ score
For all other indicators and for bounds that were developed in previous projects the decision tree below developed by SDSN and Bertelsmann Stiftung was used:
- Use the absolute quantitative thresholds outlined in the SDGs and targets: e.g. zero poverty, universal school completion, universal access to water and sanitation, full gender equality. Some SDG targets also propose relative changes (e.g. halve poverty).
- Where no explicit SDG target is available, set upper bound to universal access or zero deprivation for the following types of indicators:
- Measures of poverty (e.g. working poor), consistent with the SDG ambition to “end poverty in all its forms everywhere” (Goal 1).
- Public service coverage (e.g. preschool access).
- Access to basic infrastructure (e.g. broadband access, road conditions, etc.).
- Leave No One Behind (e.g. workplace discrimination), consistent with the SDG ambition to eliminate disparate treatment for all vulnerable groups including those identified by race, indigenous status, religion, gender, sexual orientation, disability, poverty, location, and age.
- Where science-based targets exist that must be achieved by 2030 or later, use these to set 100% upper bound: target value of 1.7 tons of CO2/capita by 2050 as outlined in the Deep Decarbonization Pathways report for the United States (e.g. Goal 13: Energy-related CO2 emissions).
- Where even the best performing states lag significantly behind the international community, and the indicator matches one used in international contexts, use the average of the top 5 OECD performers or the top 5 Global Index performers.
- For all other indicators use the average of the top 5 performers.
- Use science-based thresholds for lowest acceptable or safe performance.
- Evaluate the skewness and kurtosis of the raw data. When absolute skewness was greater than 2.0 and kurtosis was greater than 3.5, and/or data coverage below was 80%, distributions were analyzed for further adjustments.
- Use the 2.5 percentile score of the available data to account for outliers.
Goal scores were calculated by averaging the normalized score for each indicator in the Goal, weights were not applied to any indicators. The Overall score was calculated by averaging the 15 Goal scores. There is no included data for Goals 14 and 17 of the SDGs due to difficulty identifying comparable and relevant data across states in those Goals. At the Goal level, if a state was missing data for more than half of the Goal’s indicators, the Goal score was suppressed. No imputed values are used, if a state had fewer than half of the indicators for any given Goal, no Goal score was given. If a state was missing more than 20% of all indicators or more than 25% of indicators with racial values, no overall score or rank was calculated (represented by grey in the maps and other visualizations). Missing values are calculated as missing.
Table 2 | Number of Indicators
| Total | Number of Indicators | Number of racially specific indicators | Context indicators | Included topics |
|---|---|---|---|---|
| Goal 1 | 4 | 4 | 0 | Childhood Poverty; Living Below Poverty Line; Racial Disparity in Childhood Poverty; Racial Disparity in Living Below Poverty Line |
| Goal 2 | 5 | 4 | 1 | Food Insecurity; Food Access; Obesity Prevalence; Racial Disparity in Food Access; Racial Disparity in Obesity Prevalence |
| Goal 3 | 10 | 10 | 0 | Non-Communicable Diseases; Drug Overdose Death; Adults Not Seeing a Doctor Due to Cost; Infant Mortality Rate; Distance to Life Expectancy of 83; Health Insurance Coverage; Racial Disparity in Adults Not Seeing a Doctor Due to Cost; Racial Disparity in Infant Mortality Rate; Racial Disparity in Distance to Life Expectancy of 83; Racial Disparity in Health Insurance Coverage |
| Goal 4 | 9 | 9 | 0 | Bachelor's Degree; Early Childhood Education; 4-year High School Graduation Rate; Student Poverty; Racial Disparity in School Suspensions and Expulsions; Racial Disparity in Bachelor's Degree; Racial Disparity in Early Childhood Education; Racial Disparity in 4-Year High School Graduation Rates; Racial Disparity in Student Poverty |
| Goal 5 | 4 | 3 | 1 | Childcare Cost; Women in Labor Force; Race Gender Wage Gap; Race Gender Home Ownership Disparity |
| Goal 6 | 4 | 0 | 4 | Dam Safety; Air, Water, and Hazardous Waste Violation Enforcement; Toxic Water Pollution; Drinking Water Violations |
| Goal 7 | 4 | 0 | 4 | CO2 Intensity of Electricity; Low-Income Energy Burden; Renewable Energy Consumption; Renewable Energy Production |
| Goal 8 | 6 | 6 | 0 | Employment; Youth Not in School or Work, Unemployment Rate; Racial Disparity in Employment; Racial Disparity in Youth Not in School or Work; Racial Disparity in Unemployment Rate |
| Goal 9 | 5 | 4 | 1 | Road Condition; Broadband Access; STEM Degrees; Racial Disparity in Broadband Access; Racial Disparity in STEM Degrees |
| Goal 10 | 7 | 3 | 4 | Gini Coefficient; Hate Group Concentration; Racism Index; State Supreme Court Diversity; Neighborhood Poverty; Local Representation Gap; Racial Disparity in Neighborhood Poverty |
| Goal 11 | 5 | 2 | 3 | Affordable Housing; Overcrowded Housing; Particulate Matter Exposure; Rent Burdened Population; Racial Disparity in Commute Length |
| Goal 12 | 3 | 1 | 2 | Toxic Chemical Pollution; Racial Disparity in Toxic Air Burden from Nearby Facilities; SO2 emissions |
| Goal 13 | 6 | 2 | 4 | Resilient Building Codes, FEMA Mitigation Plans, Greenhouse Gas Emissions, Weather Related Injuries, Pollution Burden, Racial Disparity in Pollution Burden |
| Goal 15 | 3 | 0 | 3 | Change in Forest Area; Non-Carbon Ecological Footprint; Proximity to Parks |
| Goal 16 | 5 | 4 | 1 | Independent Redistricting Score; Incarceration Rate; Racial Disparity in Police Involved Fatalities; Racial Disparity in Youth Incarceration; Racial Disparity in Incarceration Rate |
| Total | 80 | 51 | 29 |
A central limitation of this work is the lack of available racially disaggregated data on topics central to the Sustainable Development Goals, and human flourishing more broadly (see above). Data is also limited by the number of racial groups reported in some topics (see Figure 1), and the specificity of those groups. While particular estimates may vary with methodological choices and data selection, it is clear that the overarching finding of widespread racial inequality is supported by the available data. Though broad measurement and analysis are better than none at all, improved data collection and reporting is vital.
While this work provides a starting point and overview, more nuanced investigation and research is needed. Both the generalization, and the lack of standardization, of racial categories across data sources collapses important differences within and across racial groups. Further, while this work focuses on racial differences, important intersections of identity like gender, ability, religion, class, and sexuality play a role in further explaining inequality. Those are not included here and are important areas for future work. Other areas for further exploration include the use of longitudinal data to understand how these inequalities are changing over time. Finally, as the Leave No One Behind Agenda continues to be analyzed in the US context, it is essential that further research is done in collaboration and following the leadership of the communities least served. History is full of examples of how data has been used to surveil, not empower, the least served communities. Following the leadership of these communities is one of the best ways to ensure that improving collection and analysis of racialized data is done in a way that serves and respects their sovereignty and agency.
While this work provides a starting point and overview, more nuanced investigation and research is needed. Both the generalization, and the lack of standardization, of racial categories across data sources collapses important differences within and across racial groups. Further, while this work focuses on racial differences, important intersections of identity like gender, ability, religion, class, and sexuality play a role in further explaining inequality. Those are not included here and are important areas for future work. Other areas for further exploration include the use of longitudinal data to understand how these inequalities are changing over time. Finally, as the Leave No One Behind Agenda continues to be analyzed in the US context, it is essential that further research is done in collaboration and following the leadership of the communities least served. History is full of examples of how data has been used to surveil, not empower, the least served communities. Following the leadership of these communities is one of the best ways to ensure that improving collection and analysis of racialized data is done in a way that serves and respects their sovereignty and agency.